
Advantages and Disadvantages: Development of a Prototype for Soil Irrigation Using Open-Loop and Closed-Loop Control
Leonardo Quarezemin Bagio¹ · Vagner da Silva Rodrigues²
¹ Computer Engineering undergraduate (2023). E-mail: leobagio2009@gmail.com ² Professor at Centro Universitário UniSATC. E-mail: vagner.rodrigues@satc.edu.br
Undergraduate thesis (TCC) — Computer Engineering, Centro Universitário UniSATC (2023). This is the full transcription of the paper; the official PDF is available through the Download PDF button above. Bibliographic references are kept in their original form (Brazilian ABNT).
Abstract
With the advance of technology combined with the need for automation in soil irrigation, there was an initiative to create an automated irrigation prototype. This paper has the general objective of presenting the advantages and disadvantages of an open- and closed-loop system, along with the following specific objectives: (I) Evaluate the cost of the system; (II) Present the data collected by the prototype; (III) Provide context on different types of irrigation; (IV) Use a sustainable energy source. To develop this project, a prototype with open- and closed-loop systems was built using low-cost components; to obtain results, an API was developed, responsible for collecting the information and sending it to the database. The information collected covered soil moisture, temperature, air humidity and battery charge. It was possible to evaluate that, in the closed-loop system, the HD-38 sensor used to collect soil moisture data has low accuracy, that the prototype has a low construction cost and higher energy consumption compared to the open-loop system. On the other hand, the open-loop system wastes more water because it irrigates even on rainy days.
Keywords: Open loop. Closed loop. Low cost. Soil irrigation.
1 Introduction
Agriculture has been a strong foundation for many countries in terms of economic return; however, not all farmers have access to technology capable of facilitating their work. As a result, they carry out planting without any soil analysis aimed at obtaining the parameters and defining which crop will best adapt and yield the best result (MEMON et al., 2023).
Thus, without access to technologies, several resources that are necessary for living beings and for agriculture, such as water, are being used incorrectly, consequently compromising their use in other activities (TEPHILA et al., 2022).
Given the importance of this precious natural resource, especially in regions where the source is scarce, conscious management must be carried out to preserve it (FLORIN; MIHAI, 2019).
Therefore, there is a need to align technological evolution in favor of the conscious management of natural resources. Such technological advances, concentrated in areas such as the Internet of Things (IoT), enable the development of low-cost prototypes and tools that favor resource preservation.
In addition, IoT provides several automations whose objective is to improve processes in general. Consequently, the idea of developing an intelligent irrigation system attracts many researchers seeking to improve and evolve the process in order to reduce human effort, water and energy consumption, thus achieving several ecological gains and autonomy within the process (SINGH; SAIKIA, 2016).
Based on the information presented above, the following research problem arises: What are the advantages and disadvantages of building a prototype of an open- and closed-loop system?
This work has the general objective of presenting the advantages and disadvantages of the open- and closed-loop prototype.
To help achieve the general objective, the following specific objectives are set: (I) Evaluate the cost of the system; (II) Present the data collected by the prototype; (III) Provide context on different types of irrigation; (IV) Use a sustainable energy source.
This study is justified by the need to bring more information about the cost-effectiveness of automated irrigation and its positive contribution to reducing the use of natural resources in farming. In addition, it serves as a research source for society and for academia.
2 Theoretical Background
This section presents the theoretical framework that served as the basis for the study. It covers the following topics: Internet of Things (IoT), Intelligent System, Conventional Irrigation, and Sustainable Development Goals (SDGs).
2.1 Internet of Things (IoT)
The Internet of Things can be defined as the communication between smart electronic devices over the internet, thus establishing communication between machines with specific objectives assigned as needed. In this way, with communication established between several devices, many possibilities arise in the market, bringing an emerging wave of projects that can benefit various sectors (CHOI, 2014).
With the emerging market, according to Varshini and Karthikeyan (2019), we can cite the following segments that have benefited from various applications using IoT devices: (I) Transportation; (II) Education; (III) Waste management; (IV) Smart home; (V) Smart agriculture. Given this, this research focuses on creating a prototype for agriculture; of the segments mentioned above, it fits the smart agriculture application.
In this way, according to Varshini and Karthikeyan (2019), implementation in the agricultural sector helped the farmer in several ways, for example: (I) better crop management was achieved, resulting in better quality and quantity; (II) it assisted in monitoring the soil and the volume of water used, avoiding the waste of this resource. It should be noted that such processes managed by an IoT device are capable of transmitting the collected information in order to store it in a database that can be used as a basis for analysis for future improvements to the process.
2.2 Intelligent System
With the advance of IoT-related devices, the intelligent irrigation system brings several benefits that add to and improve the process as a whole. As part of the general system, several devices are used and interconnected, each assigned a function under the control of a microcontroller (WANG; KAILI; ZHIYONG, 2021).
Moreover, with the ease of connecting devices, several benefits can be highlighted, as pointed out by Wang, Kaili and Zhiyong (2021): (I) Comprehensive monitoring; (II) Reliable transmission; (III) Remote storage; (IV) Sharing of information such as light, temperature and humidity.
In addition, with the term "intelligent" in irrigation, the entire process becomes effective and efficient in several ways, especially in the preservation and management of natural resources. In this sense, because it is an intelligent system, all system parameters can be updated manually or programmed to adjust automatically according to soil conditions (SINGH; SAIKIA, 2016).
It is also worth noting that such improvements help reduce the consumption of natural resources, optimizing and automating the entire process without the need for human intervention. In addition, its implementation is simple and can help many farmers, even those with few financial resources, giving everyone access to technology and improvement, since the components are low cost (PERNAPATI, 2018).
Based on empirical knowledge, there are two types of intelligent systems that stand out in the automation process. They are discussed below.
2.2.1 Timer-Based Systems
The timer-based irrigation system is a semi-automated method that requires human intervention throughout the procedure; that is, the operating schedule and the amount of irrigation to be applied to the soil must be configured (CUNHA, 2019).
According to Medeiros (2018), the timer-based irrigation system has several negative points, such as: (I) Water waste; (II) Damage to plant health due to excessive soil moisture or to irrigating during periods when the water is too hot; (III) Long intervals without irrigation.
2.2.2 Sensor-Based Systems
Systems that use soil moisture sensors minimize water waste, since the decision to activate the irrigation system is based on the reading the sensor performs: given that the soil is already moist, moistening is not necessary, reducing water consumption and human effort in the irrigation process (NAMALA et al., 2016).
According to Florin and Mihai (2019), in a sensor-based intelligent irrigation system, the following components are normally used: (I) Microcontroller; (II) Moisture sensors; (III) Relay block; (IV) Water pump.
On the other hand, for the system to yield a positive result, it must be able to analyze the soil status in real time and the climatic needs of the crop, because upon finishing this process the system must make the decision to start the irrigation process (AHMED; ABDALLA; ELTAHIR, 2018).
2.3 Conventional Irrigation
As a risk to agricultural production, water scarcity can cause the loss of production as a whole. To remedy this type of situation, artificial irrigation is used to manage water in order to moisten the soil and provide resources for crop development (COELHO; COSTA; TEIXEIRA, 2004).
Knowing that irrigation is necessary, especially in certain regions where a given plant species does not have favorable climatic conditions for its cultivation, the use of irrigation and different types of techniques is required, whose purpose is to provide water to the plants. To use any of the irrigation techniques, one must first study some aspects of the region where it will be implemented, such as topography, soil, crop and climate (CUNHA; ROCHA, 2015).
Below, some conventional irrigation techniques are highlighted, as well as their characteristics and application method.
2.3.1 Sprinkler and Micro-sprinkler
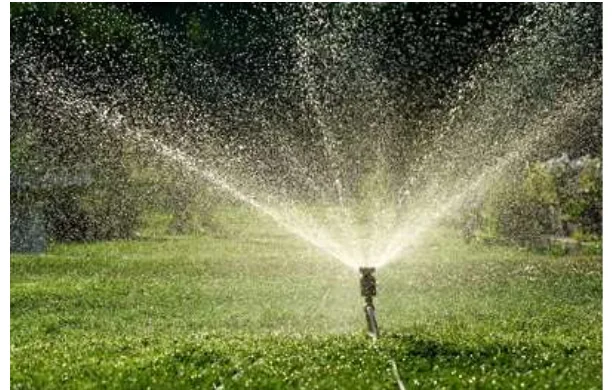
The Sprinkler Irrigation system simulates rain; that is, a jet throws water over the crop. This method is normally used by producers who employ good levels of technology in their plantations, despite its high implementation costs (STONE, [s.d.]).
The system, according to Stone ([s.d.]), has the following advantages: (I) It adapts to irregular terrain; (II) It enables labor savings; (III) It can be used to soften the air temperature and protect against frost.
According to the same author, Stone ([s.d.]), this system has the following disadvantages: (I) In regions with strong and constant winds, there may be little uniformity in water distribution; (II) Water loss through evaporation in places with low air humidity and high temperatures; (III) It may cause plant diseases due to low air humidity.
As shown in Fig. 1, this is a demonstration of the sprinkler irrigation method.
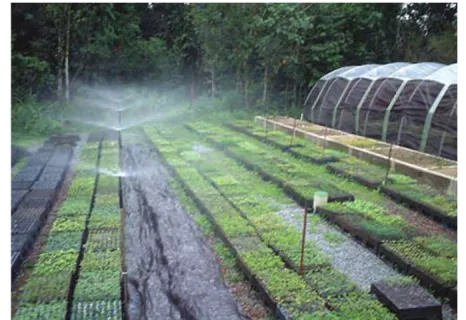
The Micro-sprinkler system delivers water to small areas, ensuring the supply of the resource; for this reason it is considered better compared to other methods, such as the sprinkler technique (MEDEIROS, 2018).
The technique, like the traditional sprinkler system, can be affected by wind due to the lack of uniformity in water application (SENAR, 2019). As shown in Fig. 2, this is a demonstration of the micro-sprinkler irrigation method.
2.3.2 Furrow
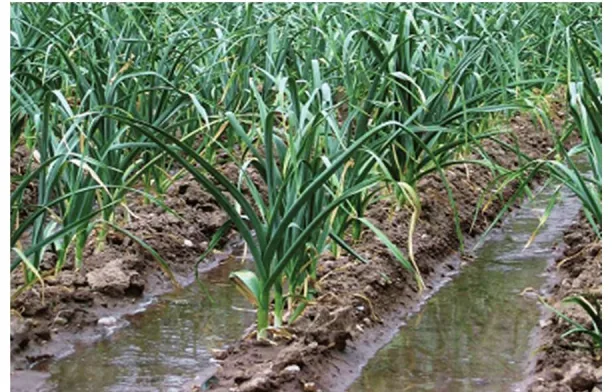
The furrow irrigation technique uses water channeled through openings in the ground, usually made by the plows used in the soil preparation process for planting (MEDEIROS, 2018).
This method is usually more used in the Northeast Region of the country in banana plantations, where the furrows to be created per row depend on the type of soil. For example: for clay soils, only one furrow per row may be made, whereas for sandy-clay soils, two furrows per row are recommended (COELHO; COSTA; TEIXEIRA, 2004). Fig. 3 represents Furrow Irrigation.
2.3.3 Sub-irrigation
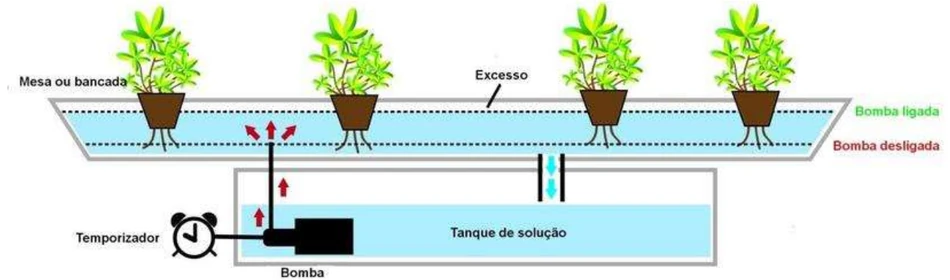
The Sub-irrigation technique consists of creating a water table beneath the crop where, through capillary rise, water reaches the roots (MEDEIROS, 2018).
According to Silveira and Stone ([s.d.]), the main advantages of this method are: (I) Reduction of labor costs; (II) Reduction of water and energy expenditure in the process; (III) Suitability for watering land while reducing water retention.
According to the same authors, Silveira and Stone ([s.d.]), the main disadvantages are: (I) The need for a water table under the proper conditions to apply the method; (II) It is specific to certain crops, such as bean planting; (III) No risk of accumulation of mineral salts in the water and soil. Fig. 4 represents the Sub-irrigation technique.
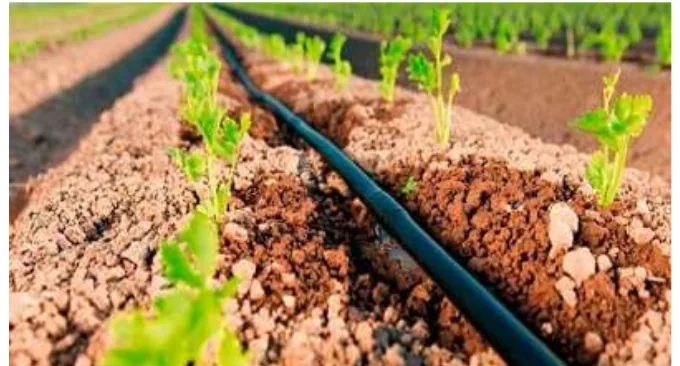
2.3.4 Drip
The drip irrigation system is made with piping with holes that runs through the entire plantation, managing the water; therefore this technique is considered simple and requires no knowledge or skills about it (MEDEIROS, 2018).
According to Medeiros (2018), the main disadvantage of this method comes from the impossibility of adjusting the dripping on the tool; that is, as the plant grows and its water needs change, there is no way to decrease or increase the amount of drops released to the soil. Fig. 5 represents Drip Irrigation.
2.4 Sustainable Development Goals (SDGs)
The Sustainable Development Goals are part of the 2030 Agenda and are a global call aimed at ensuring world peace, ending poverty and caring for fauna and flora. The UN is helping so that these goals can be achieved in order to reach the 2030 Agenda in Brazil (BRASIL, [s.d.]).
The project related to the SDGs has a total of 17 goals according to Brasil ([s.d.]); our project intends to address 2 goals, namely:
- 7 - Affordable and clean energy: Ensure access to energy services and increase the generation of renewable energy in the global energy matrix;
- 9 - Industry, innovation and infrastructure: Develop quality infrastructure and promote inclusive and sustainable industrialization;
3 Experimental Procedure
This chapter presents the topics that will support the results to be obtained through this case study, as well as the project to be developed. The first topic shows the description of the equipment, the second addresses the construction of the prototype, and the third topic presents the programming used.
3.1 Equipment
This section highlights the equipment used throughout the project in building the prototype, with a total cost of R$538.12.
Table 1 below lists the equipment used with a brief description and the total cost for each item.
| Equipment | Quantity | Total Cost | Details |
|---|---|---|---|
| BMS 2s 10a board with balancing | 1 | R$ 22.80 | Module used for charging lithium batteries with a circuit to protect the battery from damage during charging. |
| 18650 Samsung 2200mah battery | 2 | R$ 34.60 | High-storage, fast-charging battery. |
| DC DC Step Down regulator | 2 | R$ 52.00 | Voltage regulator module to reduce the input voltage to the output. |
| ESP32-IO | 1 | R$ 51.25 | Expansion module for the ESP-WROOM-32 connections to ease and improve the assembly of the prototype. |
| ESP-WROOM-32 | 1 | R$ 67.83 | Low-power microcontroller with Wi-Fi and Bluetooth connectivity. |
| 1-channel relay module | 1 | R$ 10.49 | Relay module used to cut the power to the components while idle. |
| 2-channel relay module | 1 | R$ 17.16 | Relay module used to control the activation of the irrigation pumps. |
| Mini breadboard, 170 points | 1 | R$ 9.99 | Expansion and prototyping board. |
| DH11 humidity and temperature sensor | 1 | R$ 22.90 | Sensor module capable of obtaining air temperature and humidity data. |
| Soil moisture sensor (HD-38) | 2 | R$ 53.40 | Sensor able to measure soil moisture and return the information in analog and digital form to the microcontroller. |
| 5V mini motor | 2 | R$ 33.00 | Water irrigation mini-pump for small circuits. |
| DC 0-25V voltage sensor module | 1 | R$ 13.90 | Sensor module with a voltage divider, enabling reading of the supply voltage coming from the batteries. |
| 20V solar panel | 1 | R$ 129.00 | Photovoltaic energy source with 10w of power, generating 1000mah. |
| Holder for two 18650 batteries | 1 | R$ 19.80 | Battery holder compatible with the 18650 battery in series. |
Source: Prepared by the author (2023).
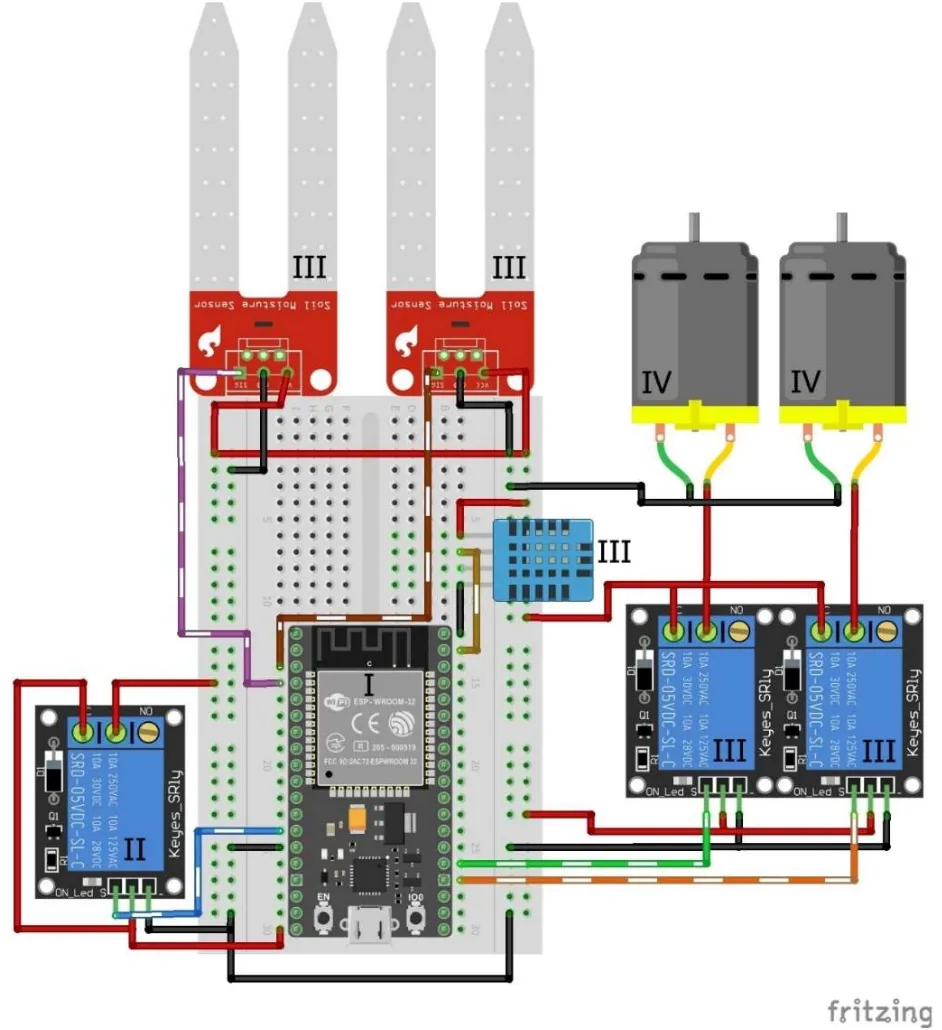
3.2 Prototype Construction
In building the prototype, the following steps were followed so that the assembly follows the same example highlighted in this paper.
- (I) Fit the ESP32-IO onto the ESP-WROOM-32 board in order to increase the number of ports and ease the connections between the terminals and the sensors.
- (II) Connect the first relay, which will be responsible for cutting the power input to the other sensors and relays precisely to save energy once the ESP enters hibernation mode.
- (III) Connect the remaining sensors, always analyzing the datasheet of each component, respecting its power supply and then connecting it to the ESP expansion board.
- (IV) Connect the water motors to the output of each relay, which will be responsible for releasing the activation voltage.
Fig. 6 below represents the construction of the prototype with step-by-step numbering as described above.
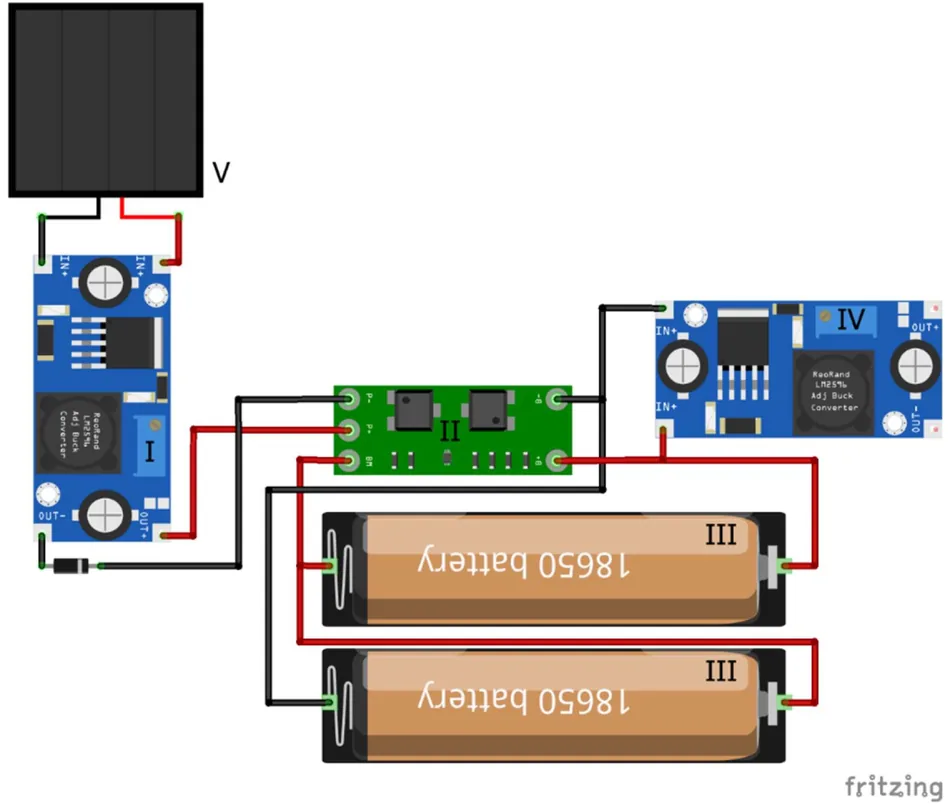
In assembling the system's power supply, referring to the batteries and the modules needed for charging, the following steps were carried out for its development.
- (I) Position the Step-Down module at the beginning of the system to reduce the voltage received from the 20v photovoltaic source to 9v.
- (II) When assembling the battery, we must solder a 2s BMS balancing and charging board to ensure that battery charging is unified and protected against minimum and maximum discharge, since it can cause problems in the project.
- (III) In assembling the batteries, two of 4.2V were used, totaling 8.4V in series, which allows the system to be powered with a minimum requirement of 5V.
- (IV) Position the step-down module at the battery output and the ESP32-IO input, adjusting it to keep the output voltage at 5V.
- (V) Connect the solar panel to the step-down module input in order to start charging the batteries.
Fig. 7 below represents the construction of the prototype's battery pack, with step-by-step numbering as described above.
3.3 ESP32 Programming
The system as a whole was divided into several tasks, each responsible for managing and executing its due functions. All the code division was managed for better cleanliness and definition, aiming at a high level in case of maintenance, since the parameters were adjusted several times up to the final version of the code.
The overall structure follows the line of the following tasks, always executing them and returning after initialization at each hibernation time; thus, every time the ESP restarts its tasks, it will execute all of them sequentially.
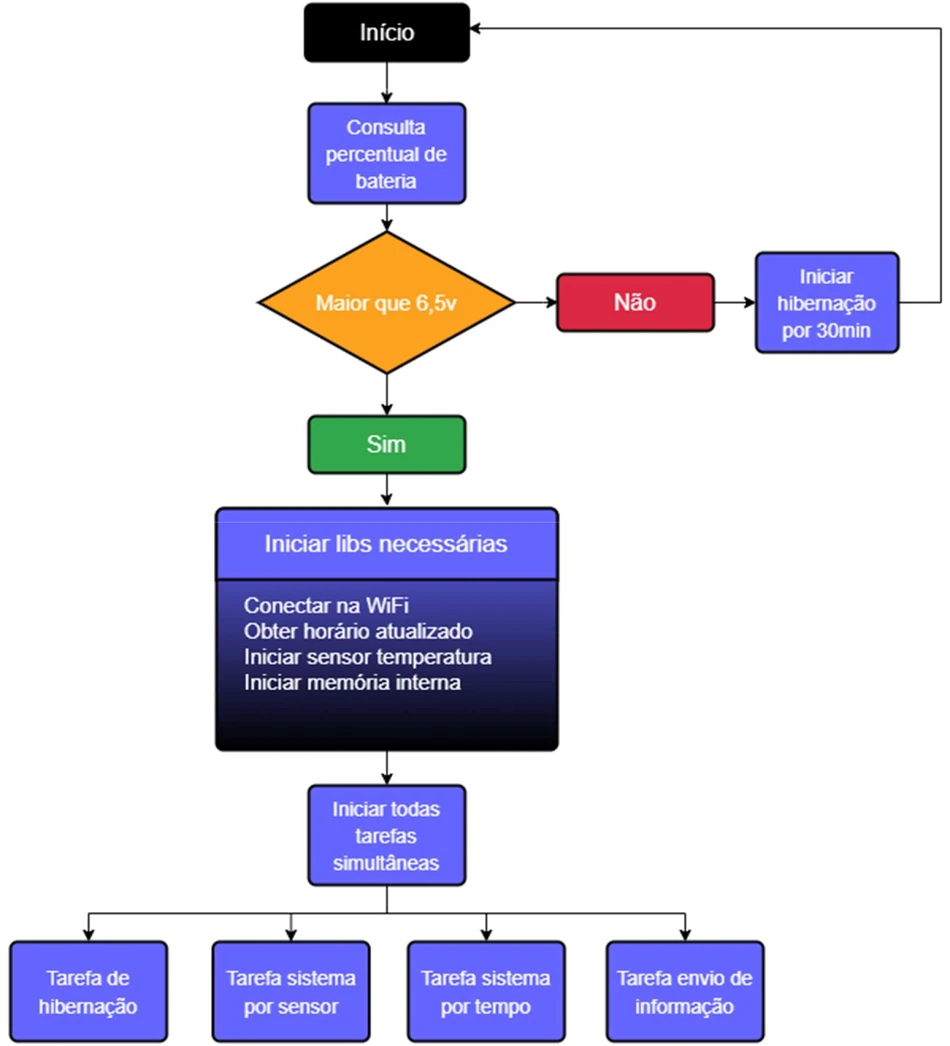
Starting with the initial configuration, the battery percentage is checked — a control created to preserve battery health and not operate at low charge voltages, which will extend its lifetime. After the check, all the libraries needed for its operation are started and all tasks are initialized simultaneously with the RTOS management available on the ESP32.
As shown in the flowchart in Fig. 8, the operation of the program's initial setup is demonstrated.
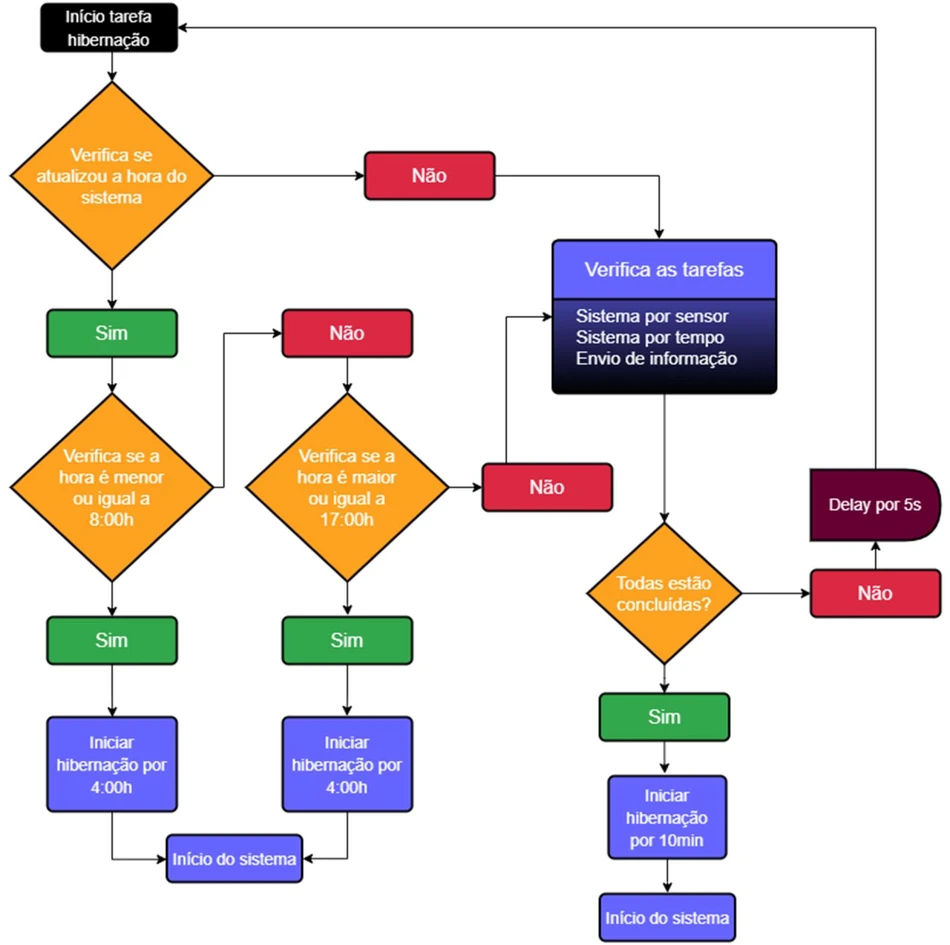
The hibernation task was developed with the purpose of controlling the project's operating schedule in order to save energy. In this way, the prototype will hibernate when all tasks are completed.
By operating with hibernation in microcontrollers, energy consumption is drastically reduced, thus extending the battery charge.
Fig. 9 demonstrates the flowchart of the detailed operation of the hibernation system.
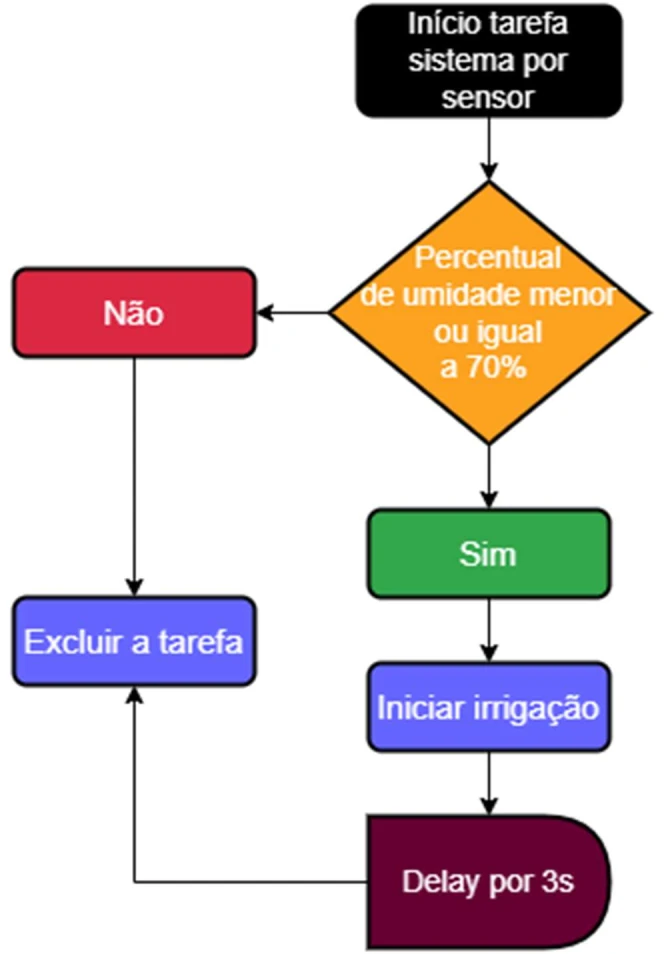
The sensor-based system task acts on the first premise of the project, which would be closed-loop control, where any and every decision about the moment of irrigation is based on the soil moisture sensor reading.
To make this possible, bench tests were carried out in order to define the activation parameters that serve as triggers to start and end irrigation; in this way the following values were reached as minimum and maximum.
The start percentage was set at less than or equal to 70%: it will start irrigation for 3s, then delete the task. For better understanding, Fig. 10 presents the flowchart of the detailed operation of the sensor-based system.
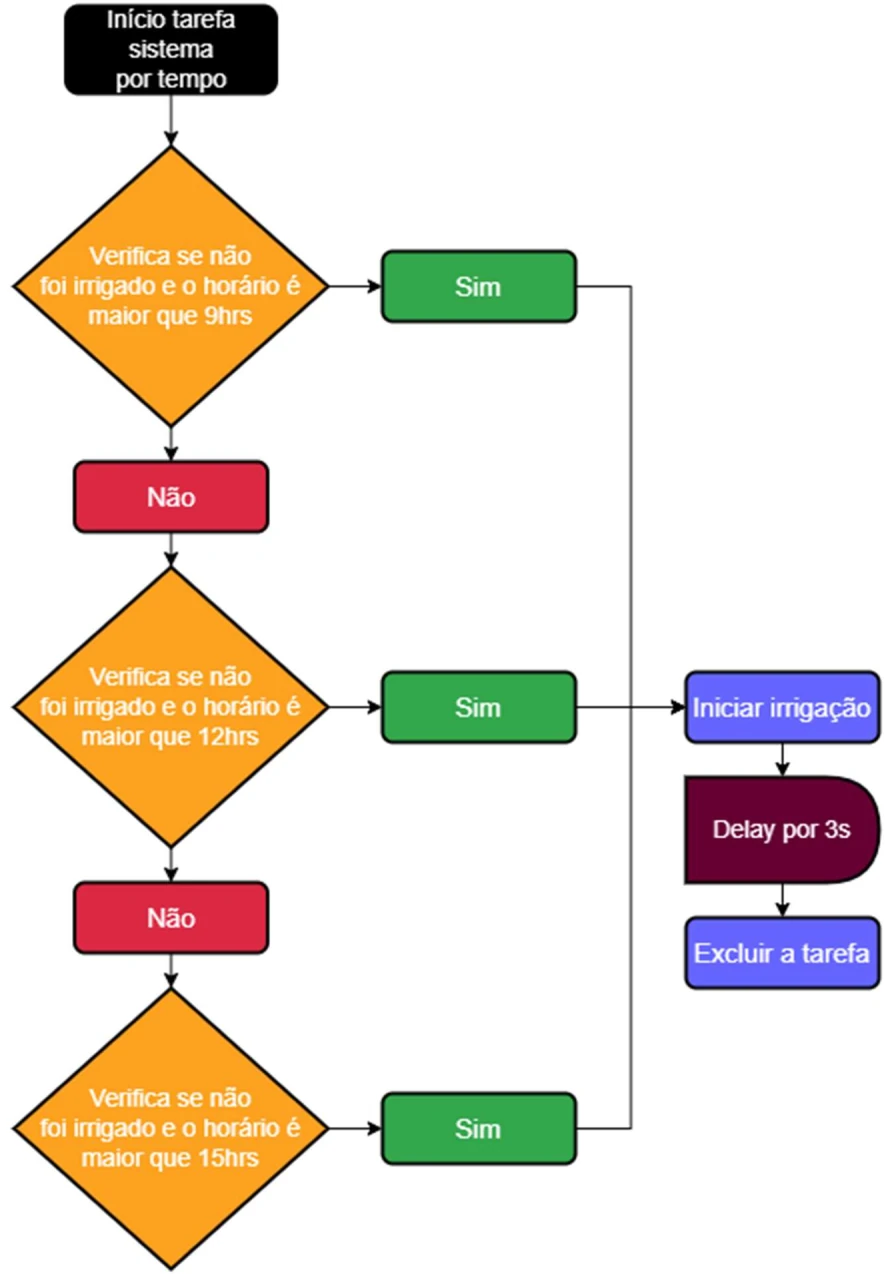
The time-based system task will act according to the second premise of the project, which would be open-loop control, where every irrigation decision is based on schedules; these, in turn, were defined through empirical knowledge, where it was decided to irrigate three times a day.
Once the schedules were defined, it will act whenever the time is equal to or greater, thus starting the irrigation cycle, which lasts 3s and will never repeat the same time on the same day.
Fig. 11 presents the flowchart of the detailed operation of the time-based system for a better understanding of the routine.
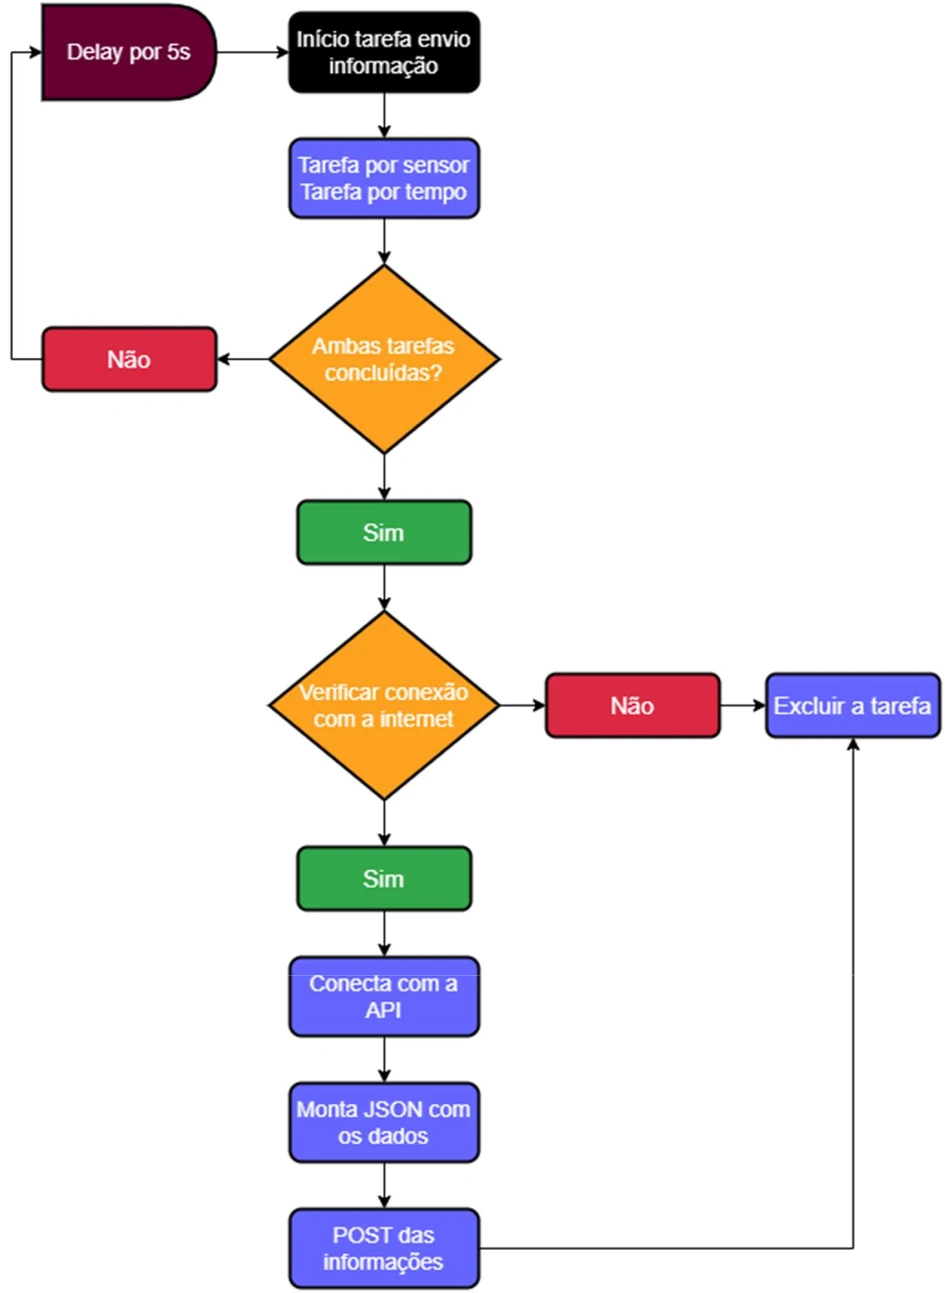
The last task developed was the information-sending task, which in turn will be responsible for collecting all the data available in the prototype in order to answer the research problem and the objectives raised in this project.
In this way, it will connect to an API hosted on a server that will store all the data generated by the sensors; the following data were collected: (I) Soil moisture, (II) Temperature, (III) Air humidity, (IV) Battery voltage.
Fig. 12 below shows the flowchart of the detailed operation of the information-sending task.
4 Results and Discussion
This chapter presents the results obtained through the construction of the open- and closed-loop prototype. This topic will present the Reading Results.
4.1 Reading Results
Throughout the project, data were collected by reading from the operation of the prototype; these data were sent inside a JSON object directly to an API stored in the cloud, which took full responsibility for storing this information in order to give autonomy to the project.
The data presented below are a daily average; that is, throughout the day the collection was carried out more than once, starting at 8:00 and ending at 17:00 at an interval of 10 minutes for each record. Below are the tables, which will be divided into subtopics and explored in more detail.
4.1.1 Soil moisture by sensor and by time
The soil moisture table by sensor and by time, responsible for storing the data referring to the two systems (closed and open loop, respectively), was divided into two properties, namely:
- Sensor type: demonstrates the two systems, irrigation by time and by the moisture sensor (open loop and closed loop).
- Soil moisture: stores the moisture percentages.
All the highlighted properties aim to demonstrate the soil moisture for each sensor type. Chart 1 below shows the data collected from the periods of April 27 to May 14.
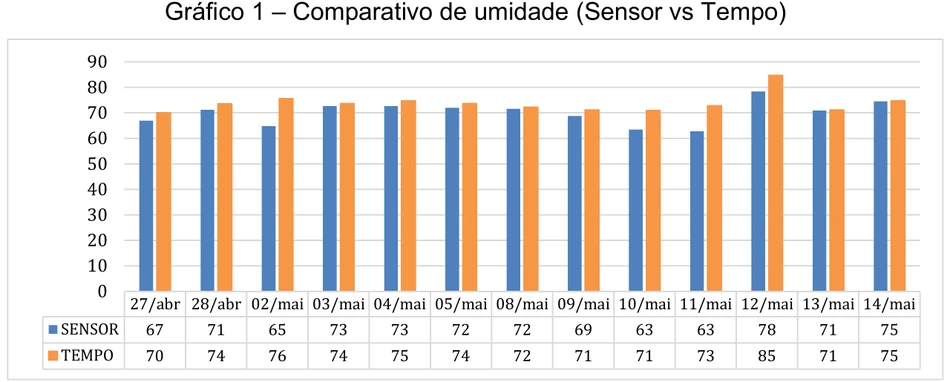
Throughout the collections, it was possible to verify that the moisture between both systems did not show great differences in the soil moisture percentage. In addition, it can be highlighted that the greatest difference occurred on 05/02/2023.
Throughout this period it was possible to observe that the moisture sensor did not have effective accuracy, as it is not possible to identify at which moments irrigation occurred due to its small range variation. Chart 2 below shows the time-based system (open loop) on 05/13/2023 with all the collections.
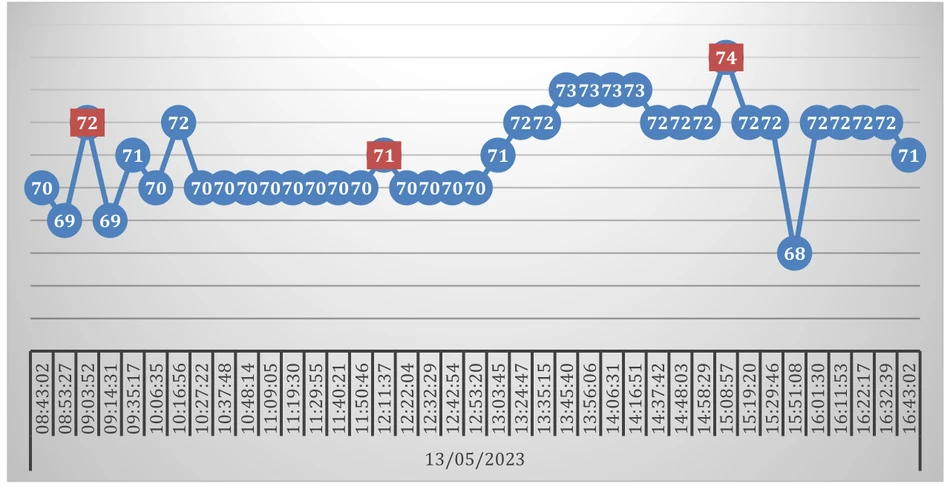
When analyzing chart 2, it is possible to observe that irrigation occurred at the defined times as highlighted in the chart. On the other hand, when comparing the moisture before irrigation with the subsequent values, there is no great variation, which proves that the sensor used does not have the necessary accuracy.
Therefore, when analyzing chart 3 of the sensor-based system (closed loop), it is not possible to identify at which moments irrigation occurred due to the sensor's measurement. Chart 3 below shows the data for 05/13/2023.
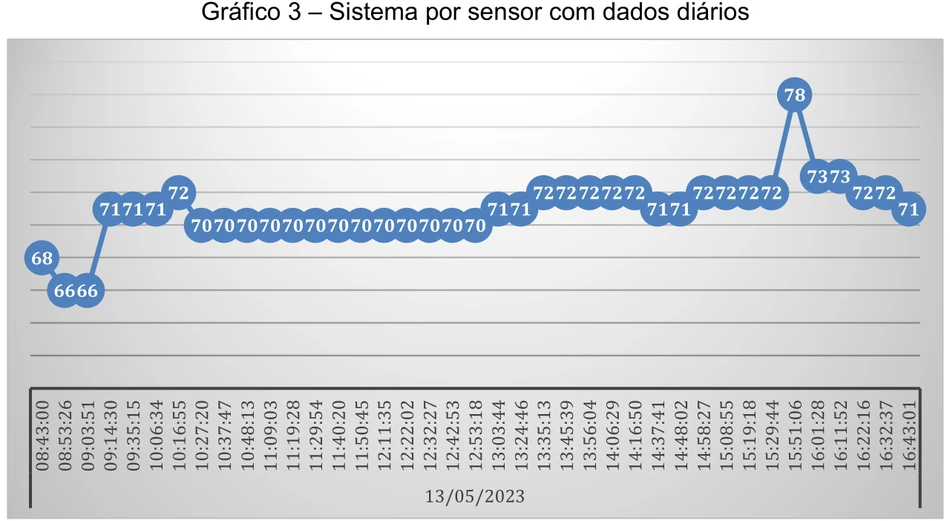
4.1.2 Battery table
The battery table is responsible for storing data referring to the voltage in volts of the battery pack; when performing the conversion, the charge percentage is returned.
These data were collected in order to ensure the project's energy efficiency, contributing to item 7 highlighted in the SDGs, which refers to affordable and clean energy.
Below are the charts with the collection of results, the first showing the voltage information and the second showing the voltage percentage of the batteries.
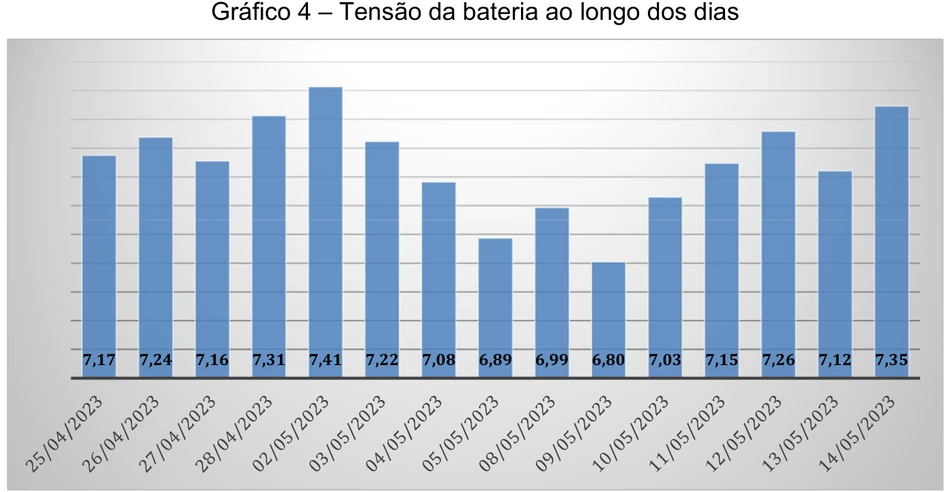
Through the API, the voltage data were collected as highlighted in chart 4. This voltage refers to the battery charge; according to the manufacturer, the nominal voltage for this battery model is 3.7V each; however, the voltage may vary from 3V to 3.7V so as not to harm the battery's lifetime.
However, the voltage may vary from 2.5V to 4.2V, but it will harm the battery's lifetime. In assembling the prototype, two batteries were inserted in series, totaling the recommended nominal voltage of 7.4V.
Chart 4 shows voltage readings of the batteries; on 05/02/2023 its average voltage exceeded the maximum charge of 7.4V. This can happen because the voltage can reach 8.4V; however, this practice, in the long term, harms the battery's lifetime.
From the chart it is possible to observe that during the collection there were periods of cloudy days, for example from 05/04/2023 to 05/09/2023, where the smallest volume of charge collected from the batteries was observed.
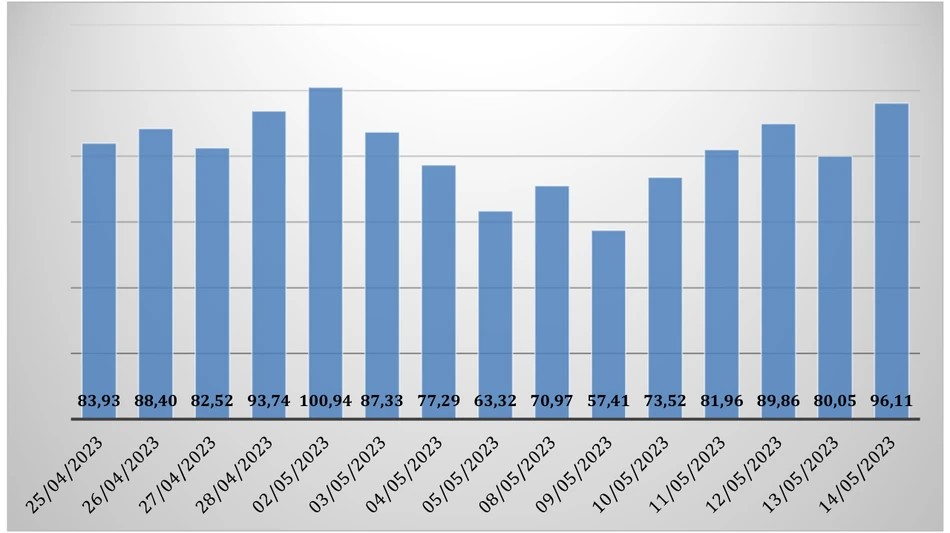
Chart 5 represents the charge percentage of the battery pack so that the visualization by users is clearer.
The collection through the API was carried out by voltage; thus, to reach the percentage, a mathematical conversion was performed using the formula below:
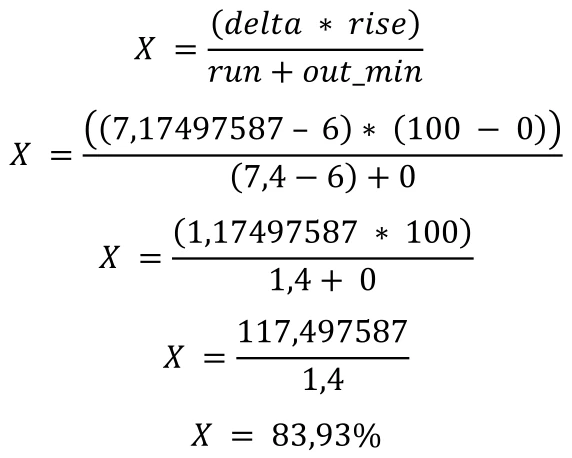
- Delta: collected value – minimum recommended charge value.
- Rise: maximum percentage value – minimum percentage value, that is, respectively from 100 to 0.
- Run: maximum recommended charge value – minimum recommended charge value.
- Out_min: minimum percentage value.
For example, on 04/25/2023 there was an average voltage of 7.17497587 V, and when converting to a percentage the value of 83.93% was reached.
4.1.3 Temperature table
The temperature table is responsible for storing the temperature data collected in degrees (°C) where the prototype is located, thus reflecting the general temperature of the prototype.
Chart 6 presents the temperature data collected for the period.
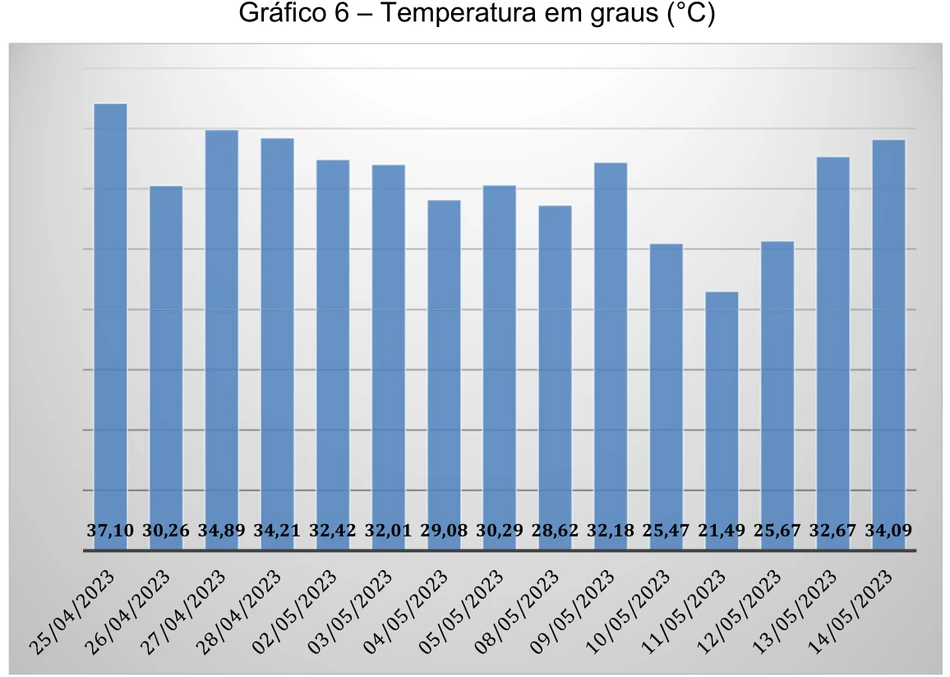
In chart 6, it can be observed that the highest average temperature was on 04/25/2023 at 37.10°C and the lowest on 05/11/2023 at 21.49°C.
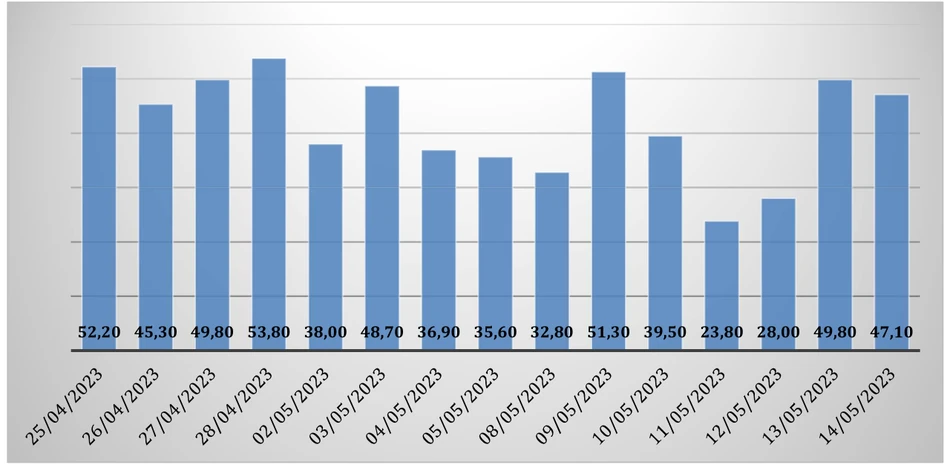
When analyzing chart 7, it can be observed that the highest temperature peak was on 04/28/2023 at 53.80°C and the lowest on 05/11/2023 at 23.80°C.
The importance of temperature control is due to the fact that, according to the battery manufacturer, it cannot withstand more than 60°C, and for this reason daily monitoring was carried out in order to ensure that this problem did not occur.
For this experiment, the exact temperature measurement on the battery was not considered, but rather that of the environment where the prototype is located, because it does not consume much current; therefore the battery temperature is close to the general environmental data.
4.1.4 Air humidity table
The air humidity table is responsible for storing the collected data referring to the air humidity where the prototype is located, its value being a percentage, as presented in chart 8 with the data collected.
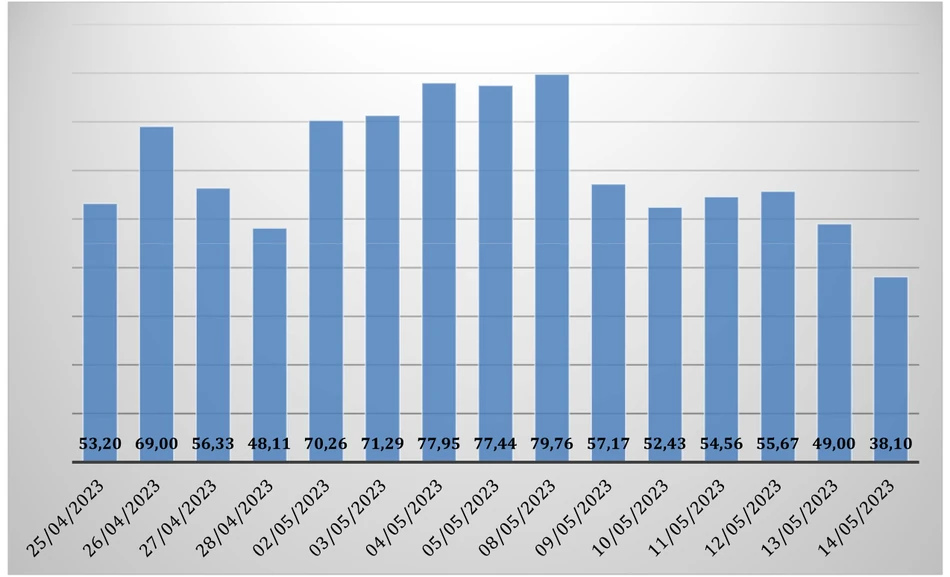
When analyzing the information collected in chart 8, it is possible to identify that the highest humidity levels were on May 4, 5 and 8, 2023, reaching values above 77%. In addition, it was possible to observe that on 05/14/2023 there was the lowest humidity inside the prototype.
This data is important for monitoring the humidity inside the prototype in order to take care of its lifetime; that is, if the environment is too humid it can damage it.
5 Conclusion
Faced with the new technological developments and the need for automation in irrigation, there was an initiative to create an open- and closed-loop prototype for soil irrigation. In this way, this case study had the general objective of presenting the advantages and disadvantages of the open- and closed-loop prototype.
The first specific objective aimed to evaluate the cost of building the prototype. Upon finishing the prototype, it is possible to observe that its construction has a low cost, as shown in the equipment table.
The second specific objective aims to present the data collected by the prototype in order to contribute to future studies. In addition, it is possible to observe links between the collected results, for example:
- On 05/05/2023, energy consumption was higher than the charging capacity, since when compared to the previous day its charge was lower. On this day the average temperature was 30°C, but the average air humidity was 77%. Thus, it is understood that the probability of it being a cloudy day is high, since the battery did not charge more than its consumption.
- On 05/14/2023 it is possible to evaluate that the air humidity is low, the temperature is high and, consequently, the battery has a high charge percentage. Therefore, it is understood that these two variables contribute to charging the battery.
- Throughout the tests and data collection, it was observed that the HD-38 sensor for reading soil moisture did not present the desired accuracy; therefore, there is no reliability in its readings.
The third objective aims to present different types of irrigation for greater knowledge of the topic addressed.
The fourth objective aims to use a renewable energy source in order to contribute to the SDG objectives. When analyzing the charts, it is possible to evaluate that for this prototype the energy expenditure is low, but even so it contributes to the environment by using a renewable energy source.
In this way, in response to the research question of the study — What are the advantages and disadvantages of an open- and closed-loop system? — it was possible to observe that the open-loop system has the following advantages and disadvantages.
- Advantages:
- Configurable by schedule, so after that there is no need for human labor.
- It has a low construction cost.
- It has low energy expenditure compared to the closed-loop system, since it can hibernate between irrigation periods.
- Disadvantages:
- Water waste, since it irrigates regardless of the weather and humidity; therefore, on a rainy day it will irrigate normally if no one intervenes in the process.
- Related to the disadvantage mentioned above, it is not possible to know the soil moisture at the moment of irrigation; therefore, if it is moist it will irrigate normally.
On the other hand, the closed-loop system has the following advantages and disadvantages.
- Advantages:
- Reduces water waste, since it only irrigates when the soil is dry.
- It has a low construction cost.
- Once installed, there is no need for human intervention to carry out irrigation.
- Disadvantage:
- Shorter hibernation time compared to the open-loop system, therefore it uses more energy.
- The HD-38 sensor used in this prototype has low accuracy.
Finally, it was identified as a limitation of this study the fact that the HD-38 sensor used in the prototype has low accuracy; therefore, it did not perform irrigation in the closed-loop system as expected. In this way, it is suggested to carry out new studies on the same theme, varying the types of sensors in order to make comparisons and evaluate which one has better accuracy.
References
AHMED, E. M. E.; ABDALLA, K. H. B.; ELTAHIR, I. KHIDER. Farm Automation based on IoT. 2018 International Conference on Computer, Control, Electrical, and Electronics Engineering (ICCCEEE). Anais...IEEE, ago. 2018. Disponível em: https://ieeexplore.ieee.org/document/8515853/. Acesso em: 7 maio. 2022.
BRASIL. Sobre o nosso trabalho para alcançar os Objetivos de Desenvolvimento Sustentável no Brasil. Disponível em: https://brasil.un.org/pt-br/sdgs. Acesso em: 30 abr. 2022.
CHOI, A. J. Internet of Things: Evolution towards a hyper-connected society. 2014 IEEE Asian Solid-State Circuits Conference (A-SSCC). Anais...IEEE, 13 nov. 2014. Disponível em: http://ieeexplore.ieee.org/document/7008846/. Acesso em: 22 abr. 2022.
COELHO, E. F.; COSTA, É. L.; TEIXEIRA, A. H. DE C. O Cultivo da Bananeira. Cruz das Almas - BA: [s.n.].
CUNHA, K. C. B.; ROCHA, R. V. AUTOMAÇÃO NO PROCESSO DE IRRIGAÇÃO NA AGRICULTURA FAMILIAR COM PLATAFORMA ARDUÍNO. Revista Eletrônica Competências Digitais para Agricultura Familiar, v. 1, n. 2, p. 62–74, dez. 2015.
CUNHA, M. M. Desenvolvimento de um sistema embarcado para realização de manejo de irrigação. São Cristóvão: Universidade Federal de Sergipe, 7 fev. 2019.
FLORIN, O. C.; MIHAI, N. A. Solution For Water Management Using A Smart Irrigation System. 2019 International Conference on Electromechanical and Energy Systems (SIELMEN). Anais...IEEE, out. 2019. Disponível em: https://ieeexplore.ieee.org/document/8905879/. Acesso em: 24 abr. 2022.
MAROUELLI, W. A. et al. Irrigação na cultura do alho. Brasília: [s.n.]. Disponível em: https://www.researchgate.net/publication/287640895. Acesso em: 31 maio. 2022.
MAXMAQ. Irrigação por Aspersão: Saiba tudo sobre o principal método de irrigação. Disponível em: https://maxmaq.com.br/blog/irrigacao-por-aspersao/. Acesso em: 31 maio. 2022a.
MAXMAQ. Conheça a Irrigação Por Gotejamento e Dobre Sua Produtividade. Disponível em: https://maxmaq.com.br/blog/irrigacao-por-gotejamento/. Acesso em: 31 maio. 2022b.
MEDEIROS, P. H. S. SISTEMA DE IRRIGAÇÃO AUTOMATIZADO PARA PLANTAS CASEIRAS. João Monlevade: [s.n.]. Disponível em: https://www.monografias.ufop.br/bitstream/35400000/1199/1/MONOGRAFIA_SistemaIrriga%C3%A7%C3%A3oAutomatizado.pdf. Acesso em: 10 maio. 2022.
MEMON, K. et al. A Review Based On Comparative Analysis of Techniques Used in Precision Agriculture. 2023 4th International Conference on Computing, Mathematics and Engineering Technologies (iCoMET). Anais...IEEE, 17 mar. 2023. Disponível em: https://ieeexplore.ieee.org/document/10099182/. Acesso em: 29 abr. 2023.
MORAS, L. F. D. et al. Manual Técnico para a Restauração de Áreas Degradadas no Estado do Rio de Janeiro. Jardim Botânico do Rio de Janeiro, p. 1–85, 2013.
NAMALA, K. K. et al. Smart irrigation with embedded system. 2016 IEEE Bombay Section Symposium (IBSS). Anais...IEEE, 2 dez. 2016. Disponível em: http://ieeexplore.ieee.org/document/7940199/. Acesso em: 22 maio. 2022.
PERNAPATI, K. IoT Based Low Cost Smart Irrigation System. 2018 Second International Conference on Inventive Communication and Computational Technologies (ICICCT). Anais...IEEE, 26 abr. 2018. Disponível em: https://ieeexplore.ieee.org/document/8473292/. Acesso em: 7 maio. 2022.
SENAR. Irrigação: manejo e gestão em sistema localizado. Coleção Senar - 251, p. 1–55, 2019.
SILVEIRA, P. M.; STONE, L. F. Subirrigação. Disponível em: https://www.agencia.cnptia.embrapa.br/Repositorio/AG01_12_1311200215101.html. Acesso em: 13 maio. 2022.
SINGH, P.; SAIKIA, S. Arduino-based smart irrigation using water flow sensor, soil moisture sensor, temperature sensor and ESP8266 WiFi module. 2016 IEEE Region 10 Humanitarian Technology Conference (R10-HTC). Anais...IEEE, dez. 2016. Disponível em: http://ieeexplore.ieee.org/document/7906792/. Acesso em: 14 abr. 2022.
STONE, L. F. Irrigação por asperção. Disponível em: http://www.agencia.cnptia.embrapa.br/gestor/feijao/arvore/CONTAG01_37_1311200215102.html. Acesso em: 13 maio. 2022.
TEPHILA, M. B. et al. Automated Smart Irrigation System using IoT with Sensor Parameter. 2022 International Conference on Electronics and Renewable Systems (ICEARS). Anais...IEEE, 16 mar. 2022. Disponível em: https://ieeexplore.ieee.org/document/9751993/. Acesso em: 28 abr. 2023.
TESTEZLAF, R. Irrigação: métodos, sistemas e aplicações. Campinas: Unicamp/FEAGRI, 2017.
VARSHINI, R.; KARTHIKEYAN, A. Internet of Things – Evolution, Architecture and Real Time Application- Survey. 2019 International Conference on Vision Towards Emerging Trends in Communication and Networking (ViTECoN). Anais...IEEE, 14 mar. 2019. Disponível em: https://ieeexplore.ieee.org/document/8899584/. Acesso em: 22 abr. 2022.
WANG, X.; KAILI, Z.; ZHIYONG, H. Open Field Smart Planting System of Family Farm. 2021 IEEE 6th International Conference on Computer and Communication Systems (ICCCS). Anais...IEEE, 23 abr. 2021. Disponível em: https://ieeexplore.ieee.org/document/9449242/. Acesso em: 14 abr. 2022.